- 0.8
- 11.3
- 21.8
- 32.3
- 42.8
- 53.2
- 63.7
- 74.2
- 84.7
Crime in Mexico
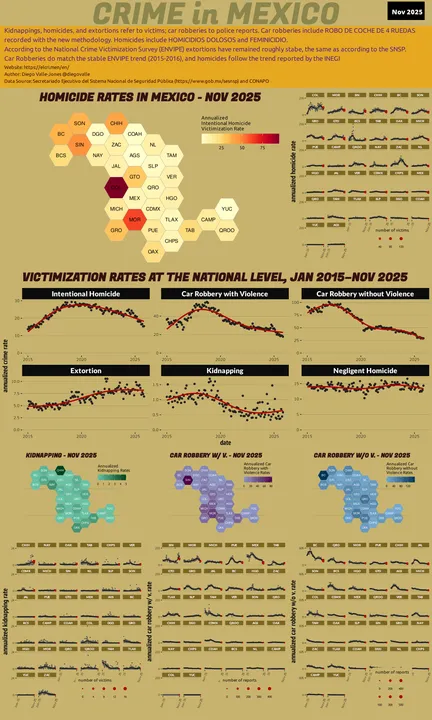
November 2025 Mexico Crime Report
map of crime rates - Nov 2025
— INEGI statistically adjusted
— SESNSP victims
— INEGI statistically adjusted
— SESNSP victims
You can click or hover over the map to show a state's crime information. The rates are per 100,000 people and calculated using 30 day months. Intentional homicides include feminicides. Oaxaca did not submit data during several months in 2015 and 2016.
Official Mexico Crime Data
Each month the Secretariado Ejecutivo del Sistema Nacional de Seguridad Pública publishes information on crimes known to the police across all of Mexico on its website in the form of pdf tables and Excel files. This website downloads, processes the data, merges it with population data, and presents it as easy to interpret crime rates.
Mexican crime data is available from police investigations (SESNSP) and also, in the case of homicides, from death certificates (INEGI). Crime data from the police is available in two ways: as the number of criminal investigations (which may concern more than one victim), and the number of victims of a crime. Crime by the number of victims is usually only available at the state level and I try to use this data whenever possible. In this website kidnappings, homicides, and extortions refer to victims; car robberies to police reports. Car robbery includes the crime of robo de coche de 4 ruedas only. Homicides include feminicides.
INEGI homicide data from death certificates tends to be more precise. Forensic coroners and the INEGI simply don't have the same incentives as the police to lower the number of homicides that happen in Mexico. In addition to homicide deaths, death certificates record deaths from legal interventions, operations of war, military operations, and terrorism, which I've added to the INEGI homicide counts. I also used a statistical model to predict the intent of deaths of unknown intent, similar to the one in this post post. The disadvantage of using the INEGI data is that it is usually more than a year out of date.
Intuitively, you can think of the statistical model as if someone were to ask you to guess the injury intent in the death of a 70-year-old Mérida woman whose cause of death was transport-related. You would probably say it was an accident. On the other hand, if you had to guess the type of death of a young adult male whose cause of death was a firearm, and the injury took place on a public street in Ciudad Juárez, you would probably guess it was a homicide.
The chart below shows INEGI homicides without any statistical adjustment since 1990
Homicides since 1990
Infographics
Charts to explain the drug war
What makes elcri.men the best criminal information site?
Crime Map
Crime is not uniformly or randomly distributed in Mexico; with this map you can find the crime hotspots in Mexico. Visualize and understand where crime is happening.
Crime Map
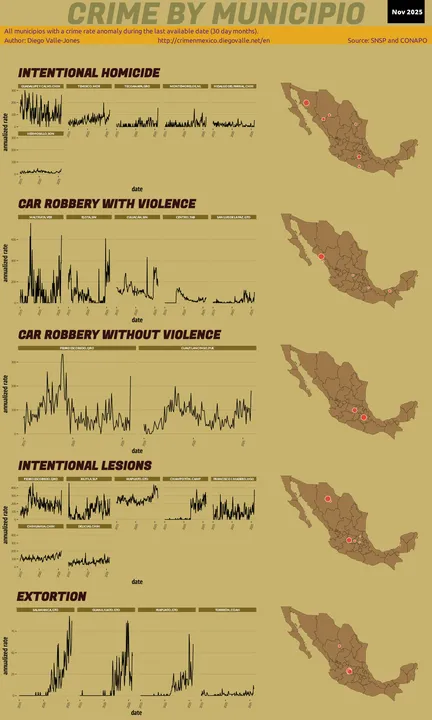
Anomalies
Detecting municipios with an unusual number of crimes should be the cornerstone of any crime fighting strategy. This website helps monitor crime spikes so that the Mexican government can take prompt action (LOL)
Anomalies
Trends
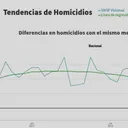
Are murders trending up or down in Mexico? Is the rate of growth in murders slowing down or going up? Will Mexico ever reach the violence levels of 2007, before the drug war started?
Trends
